EURUSD 11 – 15 Dec 2023 Weekly Analysis – FOMC Week!
This is my Weekly analysis on EURUSD for 11 – 15 Dec 2023 based on Smart Money Concept (SMC) which includes the following Time Frames:
Weekly
Daily
4H
Economic Events
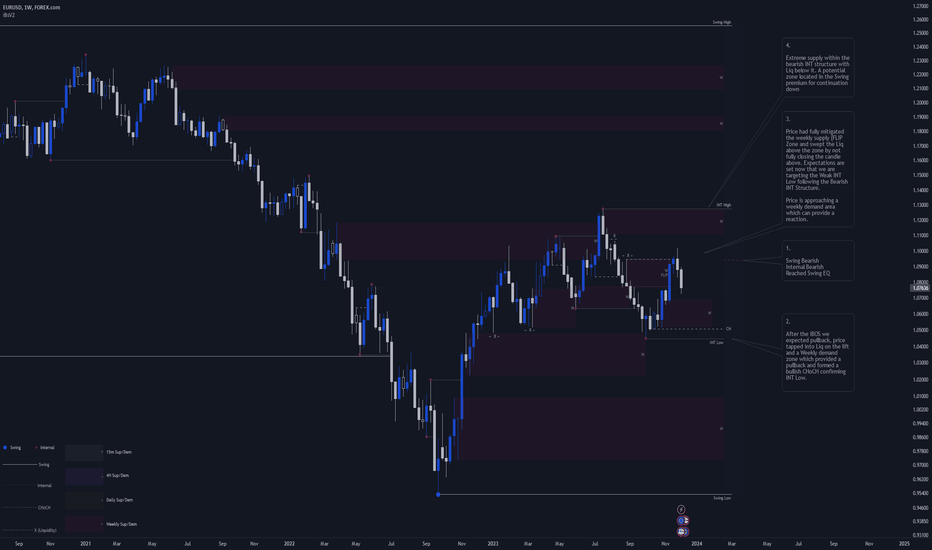
Weekly Chart Analysis
1.
Swing Bearish
Internal Bearish
Reached Swing EQ
2.
After the iBOS we expected pullback, price tapped into Liq on the lift and a Weekly demand zone which provided a pullback and formed a bullish CHoCH confirming INT Low.
3.
Price had fully mitigated the weekly supply (FLIP Zone and swept the Liq above the zone by not fully closing the candle above. Expectations are set now that we are targeting the Weak INT Low following the Bearish INT Structure.
Price is approaching a weekly demand area which can provide a reaction.
4.
Extreme supply within the bearish INT structure with Liq below it. A potential zone located in the Swing premium for continuation down
Daily Chart Analysis
1.
Swing Bearish
INT Bullish
OF Bearish
Reached EQ
2.
After BOS we expect a pullback
OF turned bullish to facilitate the Swing pullback and we formed bullish iBOS to confirm the Swing Low and the pullback.
With that pullback we formed Weekly and Daily demand zones which are potential for longs after confirmation on LTFs.
3.
After the Bullish iBOS we are expecting a pullback. First sign of the pullback maybe starting is a CHoCH which price did and confirmed INT High.
With that pullback we had formed a Supply zone that can act as a potential zone to play the pullback phase.
Price reached a daily demand zone where we have seen a reaction from on Friday after NFP news.
The mitigation of this daily demand zone could be the start of the Bullish continuation of the Daily INT Structure. But be mindful that the Daily Swing is Bearish, Reached the EQ and mitigated Daily/Weekly Supply zones, So we may have finished the Swing pullback and we are in the Swing bearish continuation to target the Weak Swing Low.
Let’s watch LTF to guide us.
4H Chart Analysis
1.
Swing Bullish
INT Bearish
Reached EQ
2.
INT structure turned bearish to liquidate the INT Low (Liquidity above the Daily Demand) and mitigated the daily demand zone.
INT Structure is currently bearish, so we are still bearish and there is a high probability that we may break the Swing Low as per the Daily/Weekly Bearish Continuation.
On the other side, 4H/Daily Swings are bullish and we are at the extremes. If we are going to continue these bullish structure then at least we need to see Bullish iBOS on the 4H. We also could benefit from LTFs to show us early if that daily mitigation could develop to be a Swing Continuation on the 4H/Daily.
Waiting for LTF to show me more developments.
3.
Swing low and last demand for potential buys.
Economic Events for the Week
Checkout latest world news below links :
World News || Latest News || U.S. News
The post EURUSD 11 – 15 Dec 2023 Weekly Analysis – FOMC Week! for FOREXCOM:EURUSD by Amr-Sadek appeared first on WorldNewsEra.

